Analysis of the flow measurement
As we noted in the Phase 1 of this series we need to maintain at least minimum air flows throughout the piping and grinding process to prevent dropout of particles in the transport piping or within the grinder/pulverizer. We must check the sensitivity of the measurement. Typically the flow measurement at the inlet of these grinders/pulverizers is performed by a differential pressure type instrument – either a Venturi or multi-ported Pitot type array. Flow through this type of device follows the general equation:
M = A * K * sqrt (H*D)
Where:
A = Area of metering section (Ft^2)
M = mass flow through metering section (Lbs/Hr Air Flow)
K = scales Area of metering section and converts engineering units
H = differential head of metering section (inches H2O)
D = density of metered fluid (air) in metering section (Lbs/Ft^3)
A quick and dirty method for calculating the density of dry air follows:
D = 39.704 / (460 + T) or
D = (39.704 / (460 + T))*(DPa / 14.696)
Where:
D = density of dry air (Lbs/Ft^3)
T = Temperature of air at metering section (Deg. F)
DPa = Absolute pressure of metering section (PSIA)
Generally the absolute pressure of the metering section does not change significantly enough to affect the flow measurement. However, if greater accuracy is required then the absolute duct pressure can be included. Since we are potentially heating and drying the material we will be using hot air. For transporting materials with 15 to 30 percent moisture by weight and a mass ratio of 1.5 to 2.0 Lbs air per 1.0 Lb of solids, we can expect full load inlet hot air temperatures between 500 deg F and 700 deg F. and outlet mixed air/product temperatures of 150 deg F. It should be noted that the material will not be completely dried. There will be an equilibrium around the discharge temperature between the mixed fluid temperature and the moisture in the solids (adiabatic saturation temperature/wet bulb). Partial load grinding air flows will be limited by the minimum air flow requirements through the system. We could expect inlet temperatures between 250 and 350 deg F. So during the normal operational range we could see inlet temperatures between 250 and 700 deg F. If we plot the resulting flows at various temperatures, we could see the variation in the reported measurement.
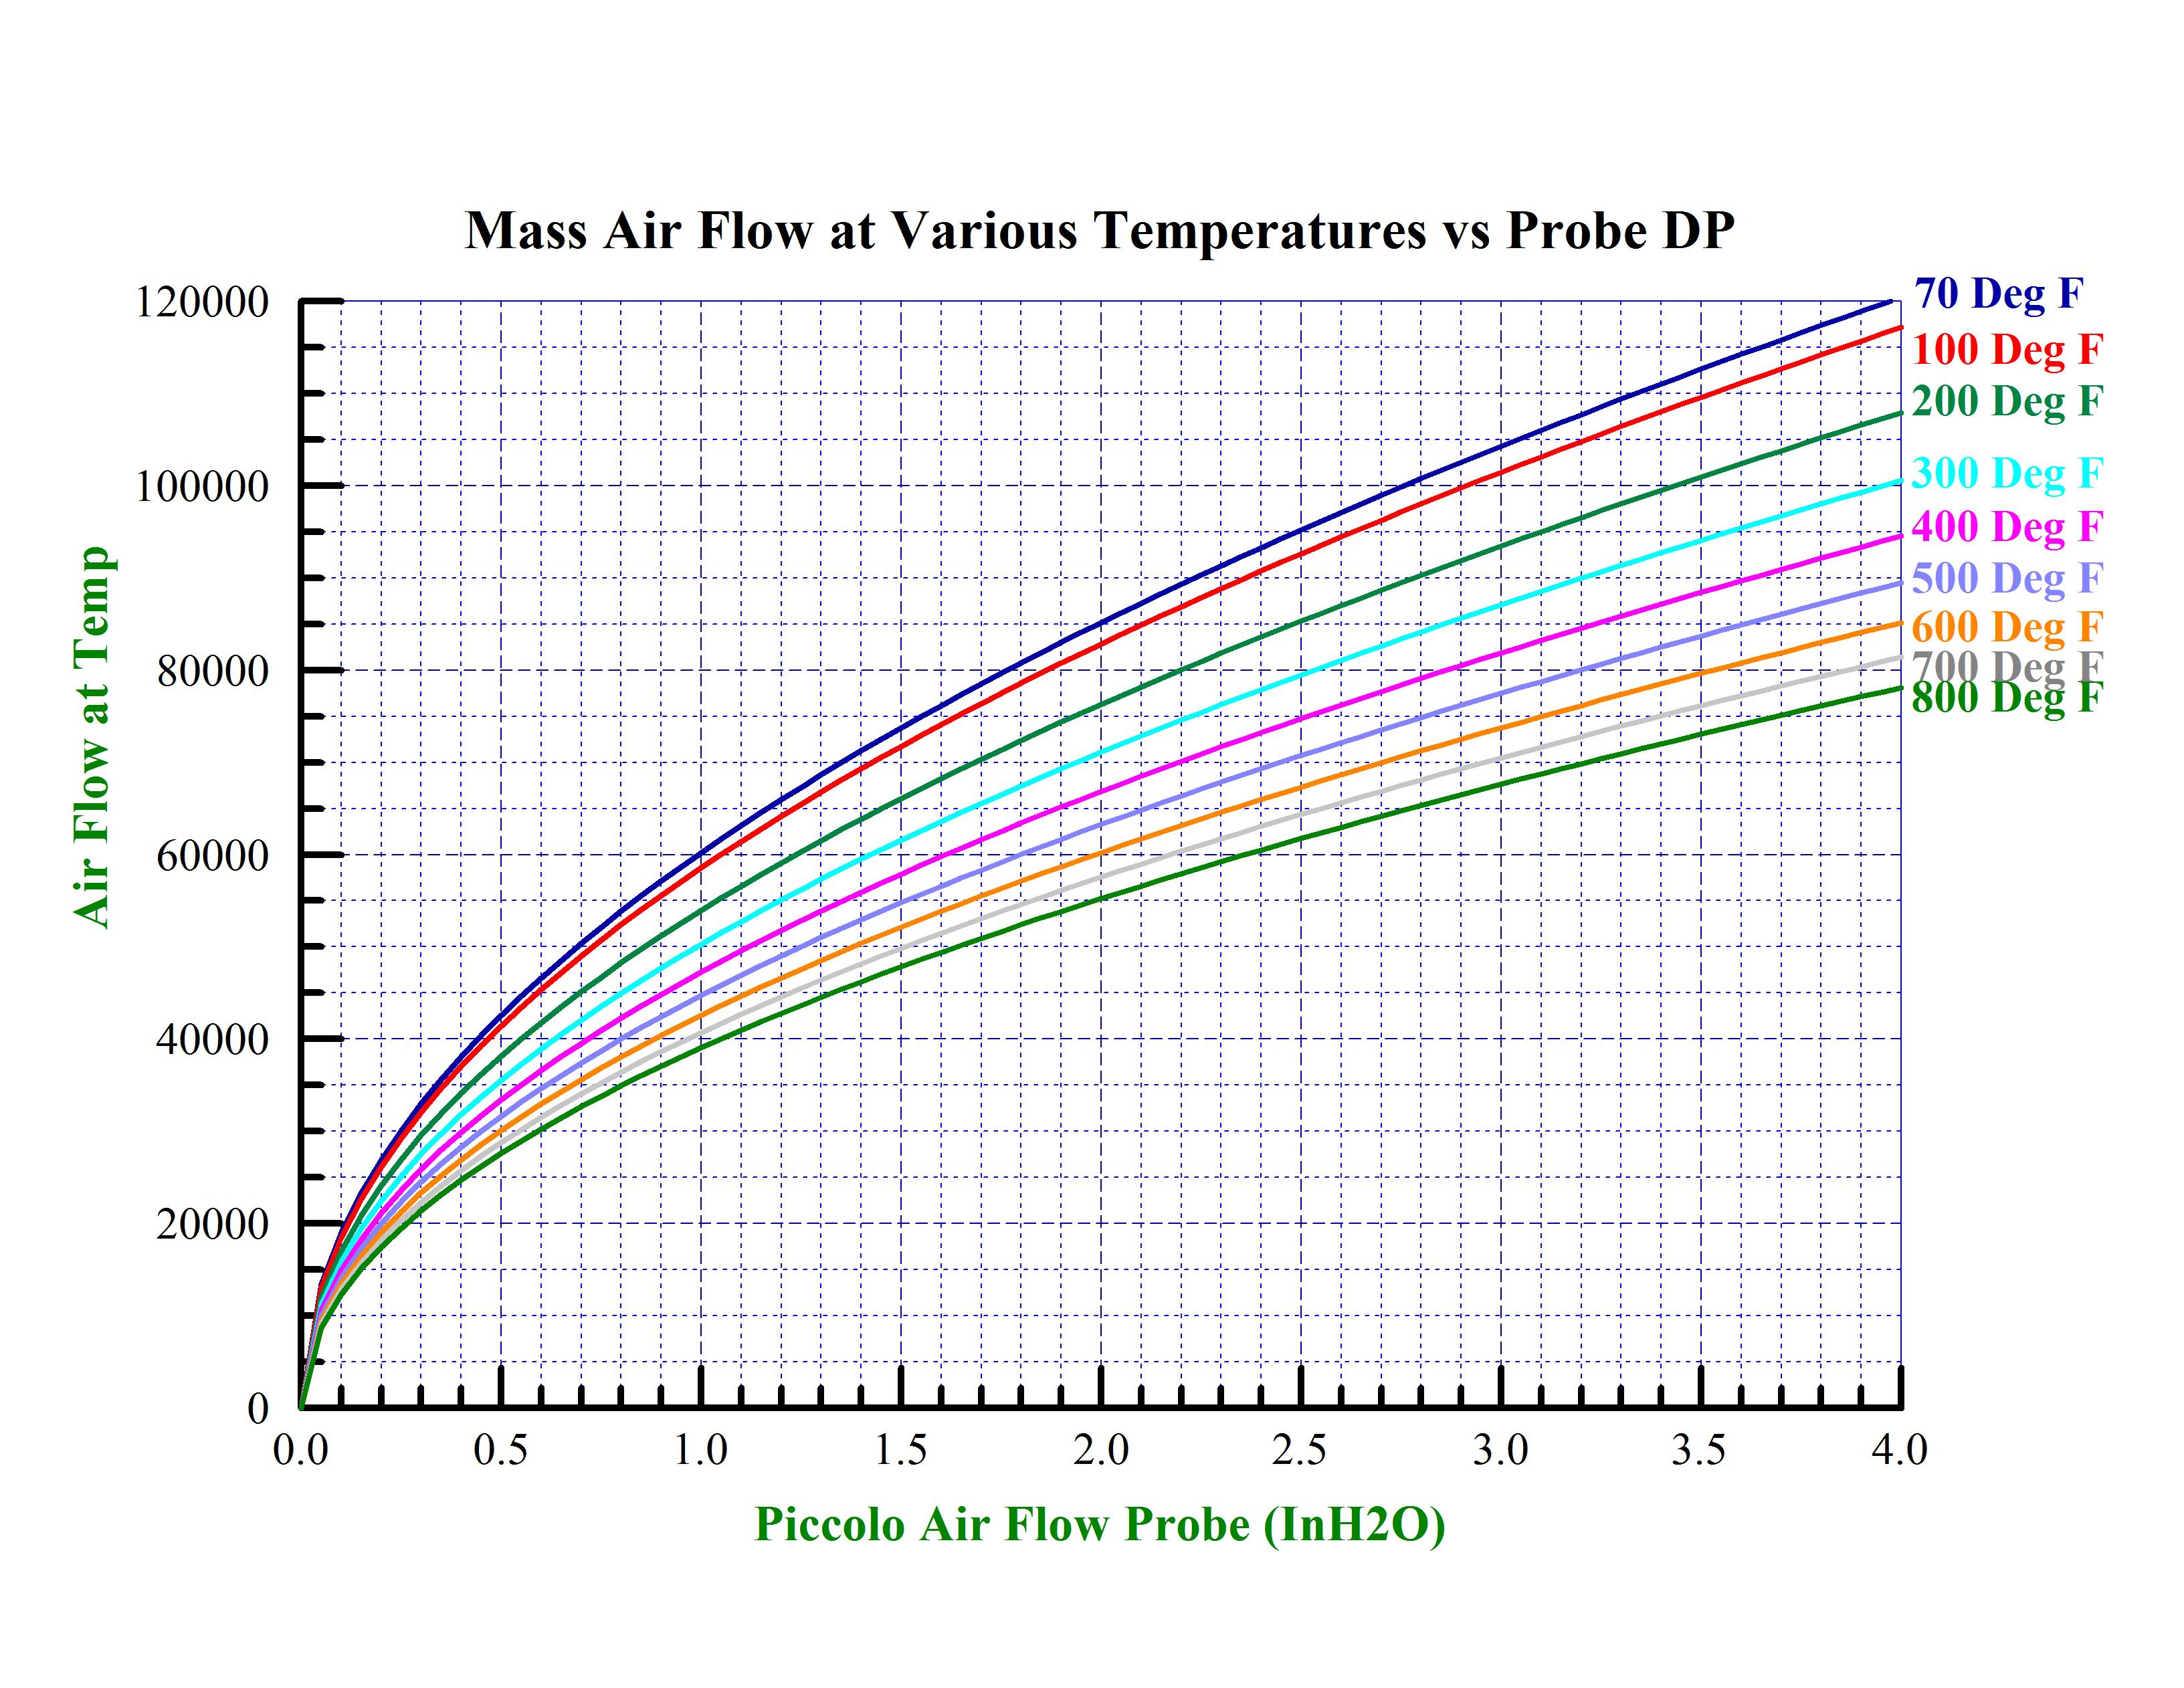
By looking at the graph we can see that there can be as much as a 25% error over the operating temperature range. Whatever flow algorithm is used, we must incorporate temperature compensation into the air flow calculation.
We then do a quick check of potential barometric errors. We have seen as much as 2 inches Hg barometer change over a 12 hour period when an extreme low pressure area passes over us. This equates to approximately 1 PSIA. pressure change. If we take a look at the potential correction for this change we find:
Delta Flow Ratio = Sqrt (14.7/(14.7 – 2))
Delta Flow Ratio = 1.036
Since a 3-1/2 percent error is usually tolerable, barometric pressure is generally not included in the calculations. But if higher accuracy is needed, then both a pressure/temperature compensation of the flow measurement is required.
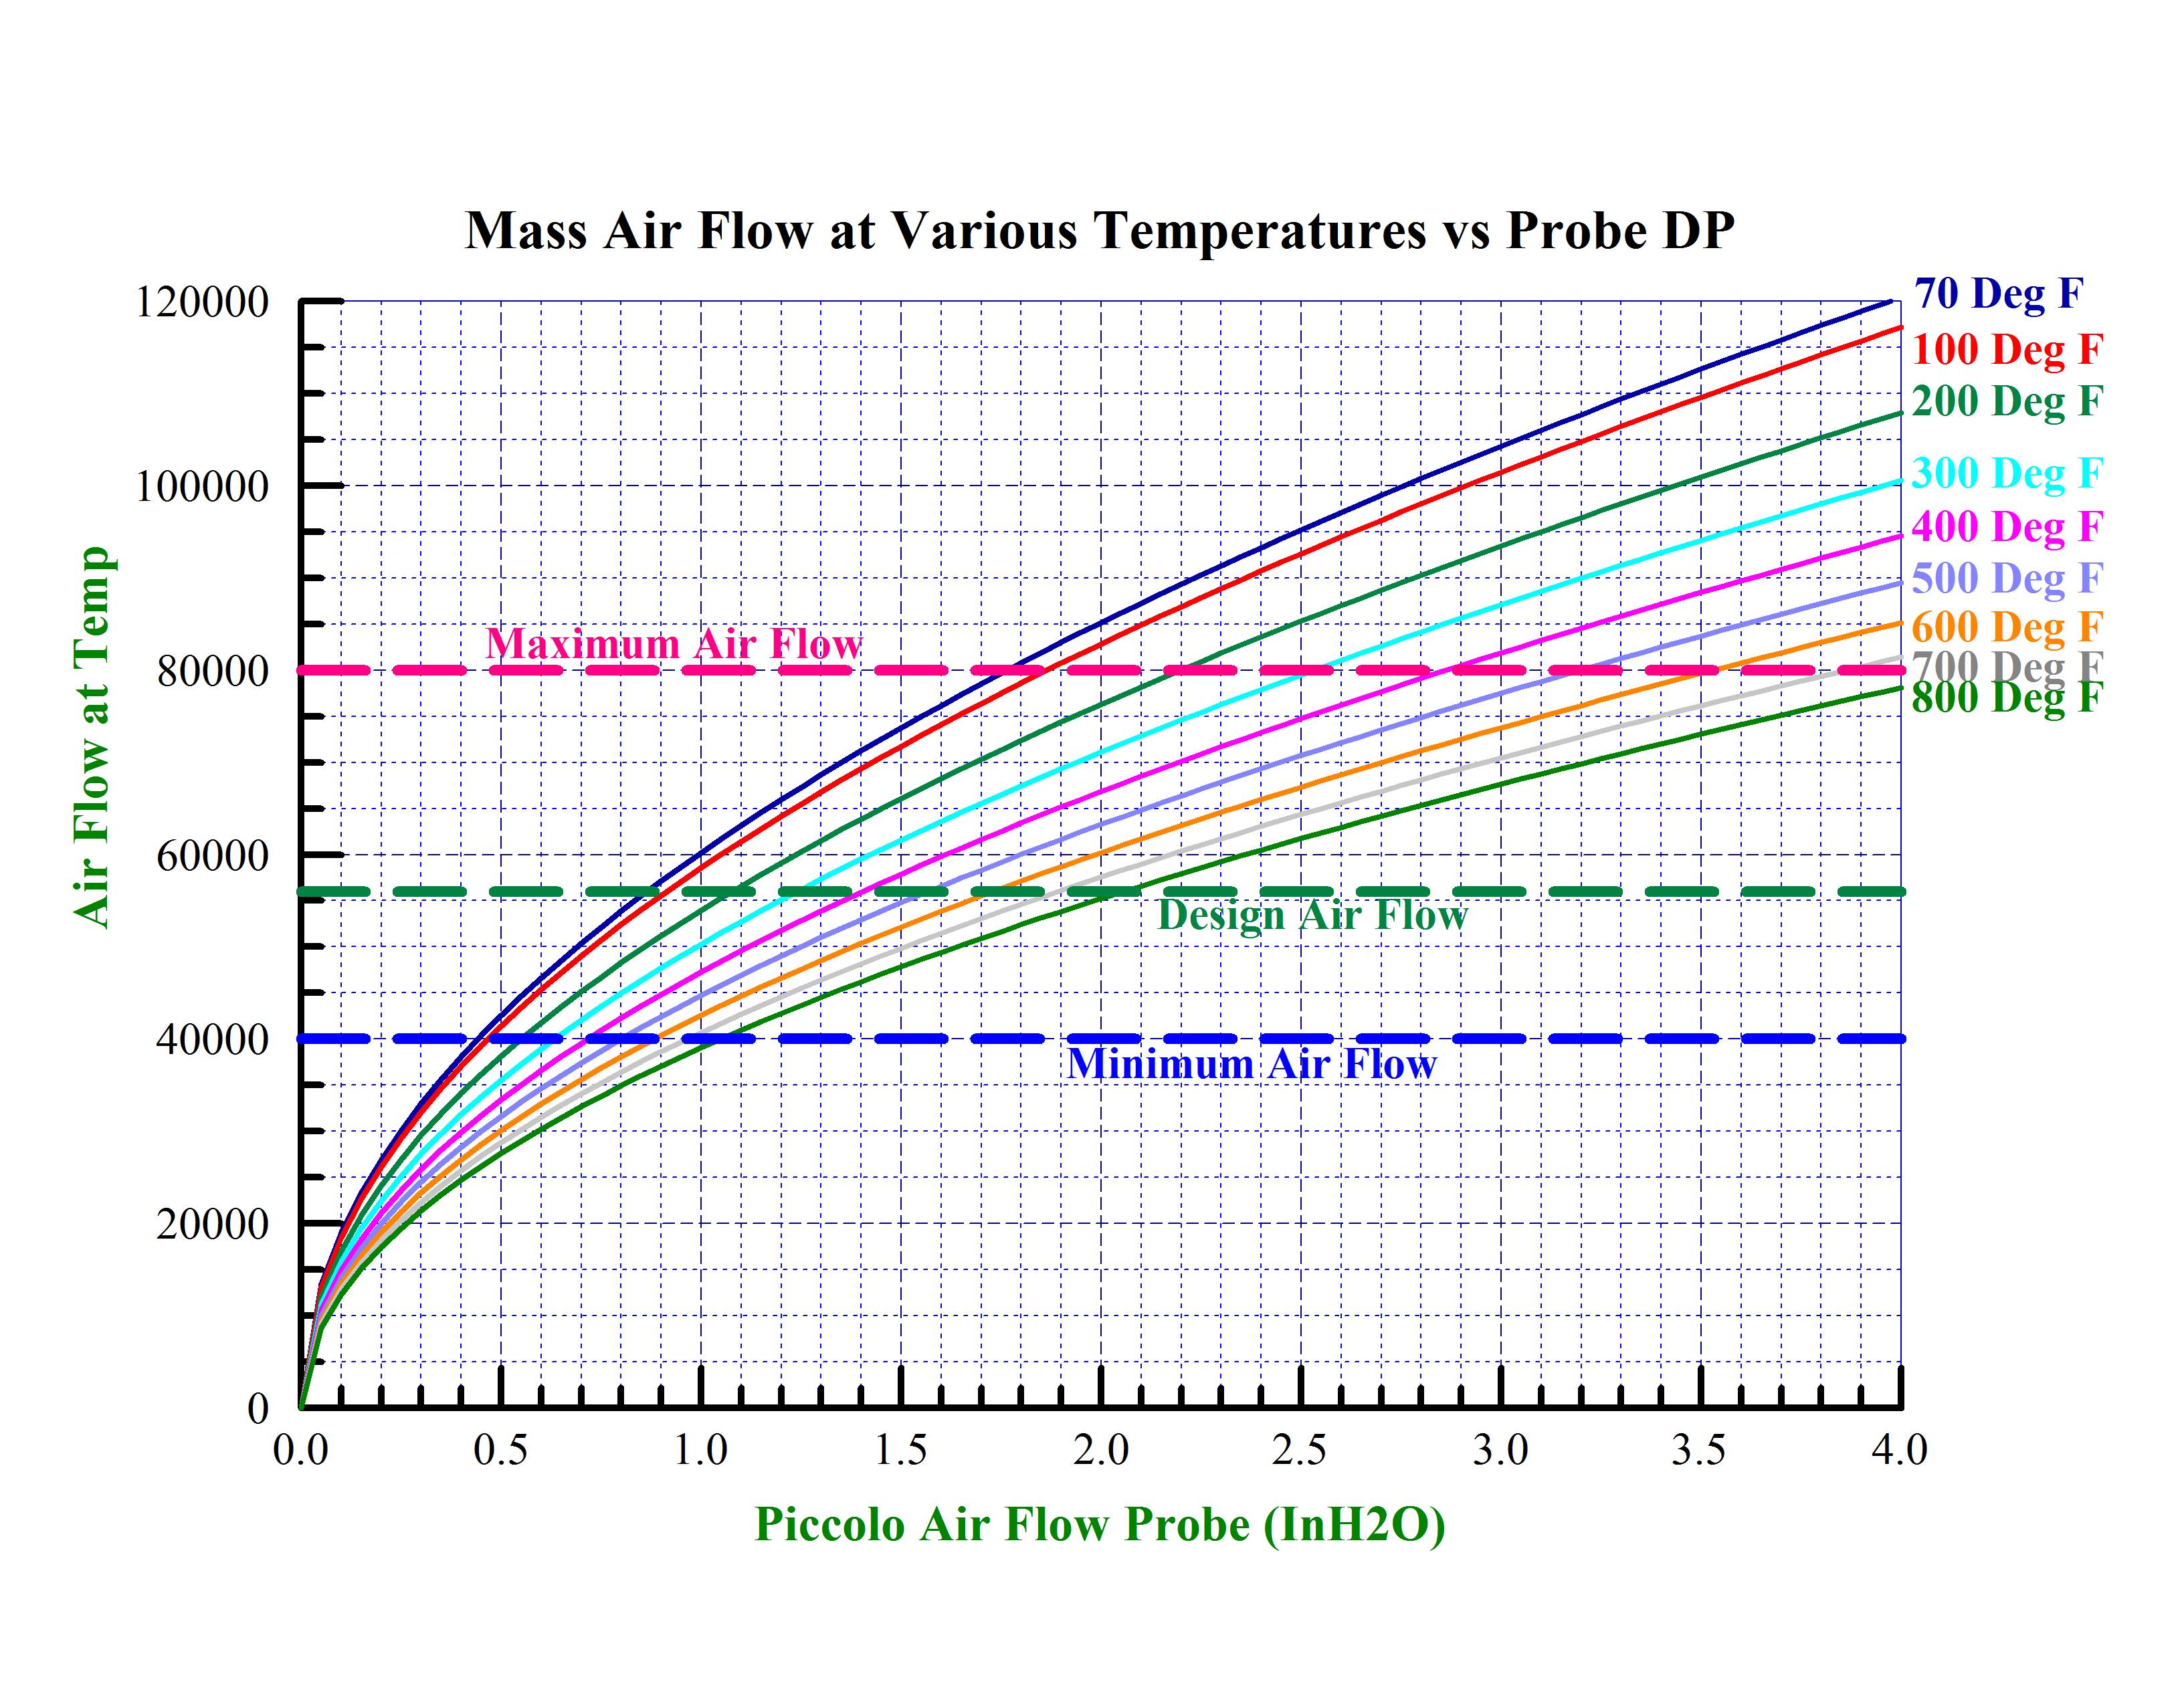
Minimum air flow is established by the grinder/pulverizer manufacturer and the size of the transport piping. This establishes the minimum line on the chart. The Design air flow is what the grinder/pulverizer manufacturer expects for his equipment and will produce the greatest through-flow and quality of the ground product. Maximum air flow is that flow which will significantly exceed normal wear of the transport piping, cause improper classification of the ground material of or cause problems in the downstream equipment.
At this point we have now identified and analyzed the flow requirements and accuracy requirements. We plot these constraints on the flow graph and include this information for the future design of the control system. The resulting graph will look like:
In the next submission, we will look at the overall dynamics of the process. In a combustion process, we may need to make use of the potential dynamics and inherent storage within the pulverizing system to enhance the overall process.
Next time:
Grinding, drying and transport project – Phase 3
Accommodating Process Dynamics